What the Dashboard is for
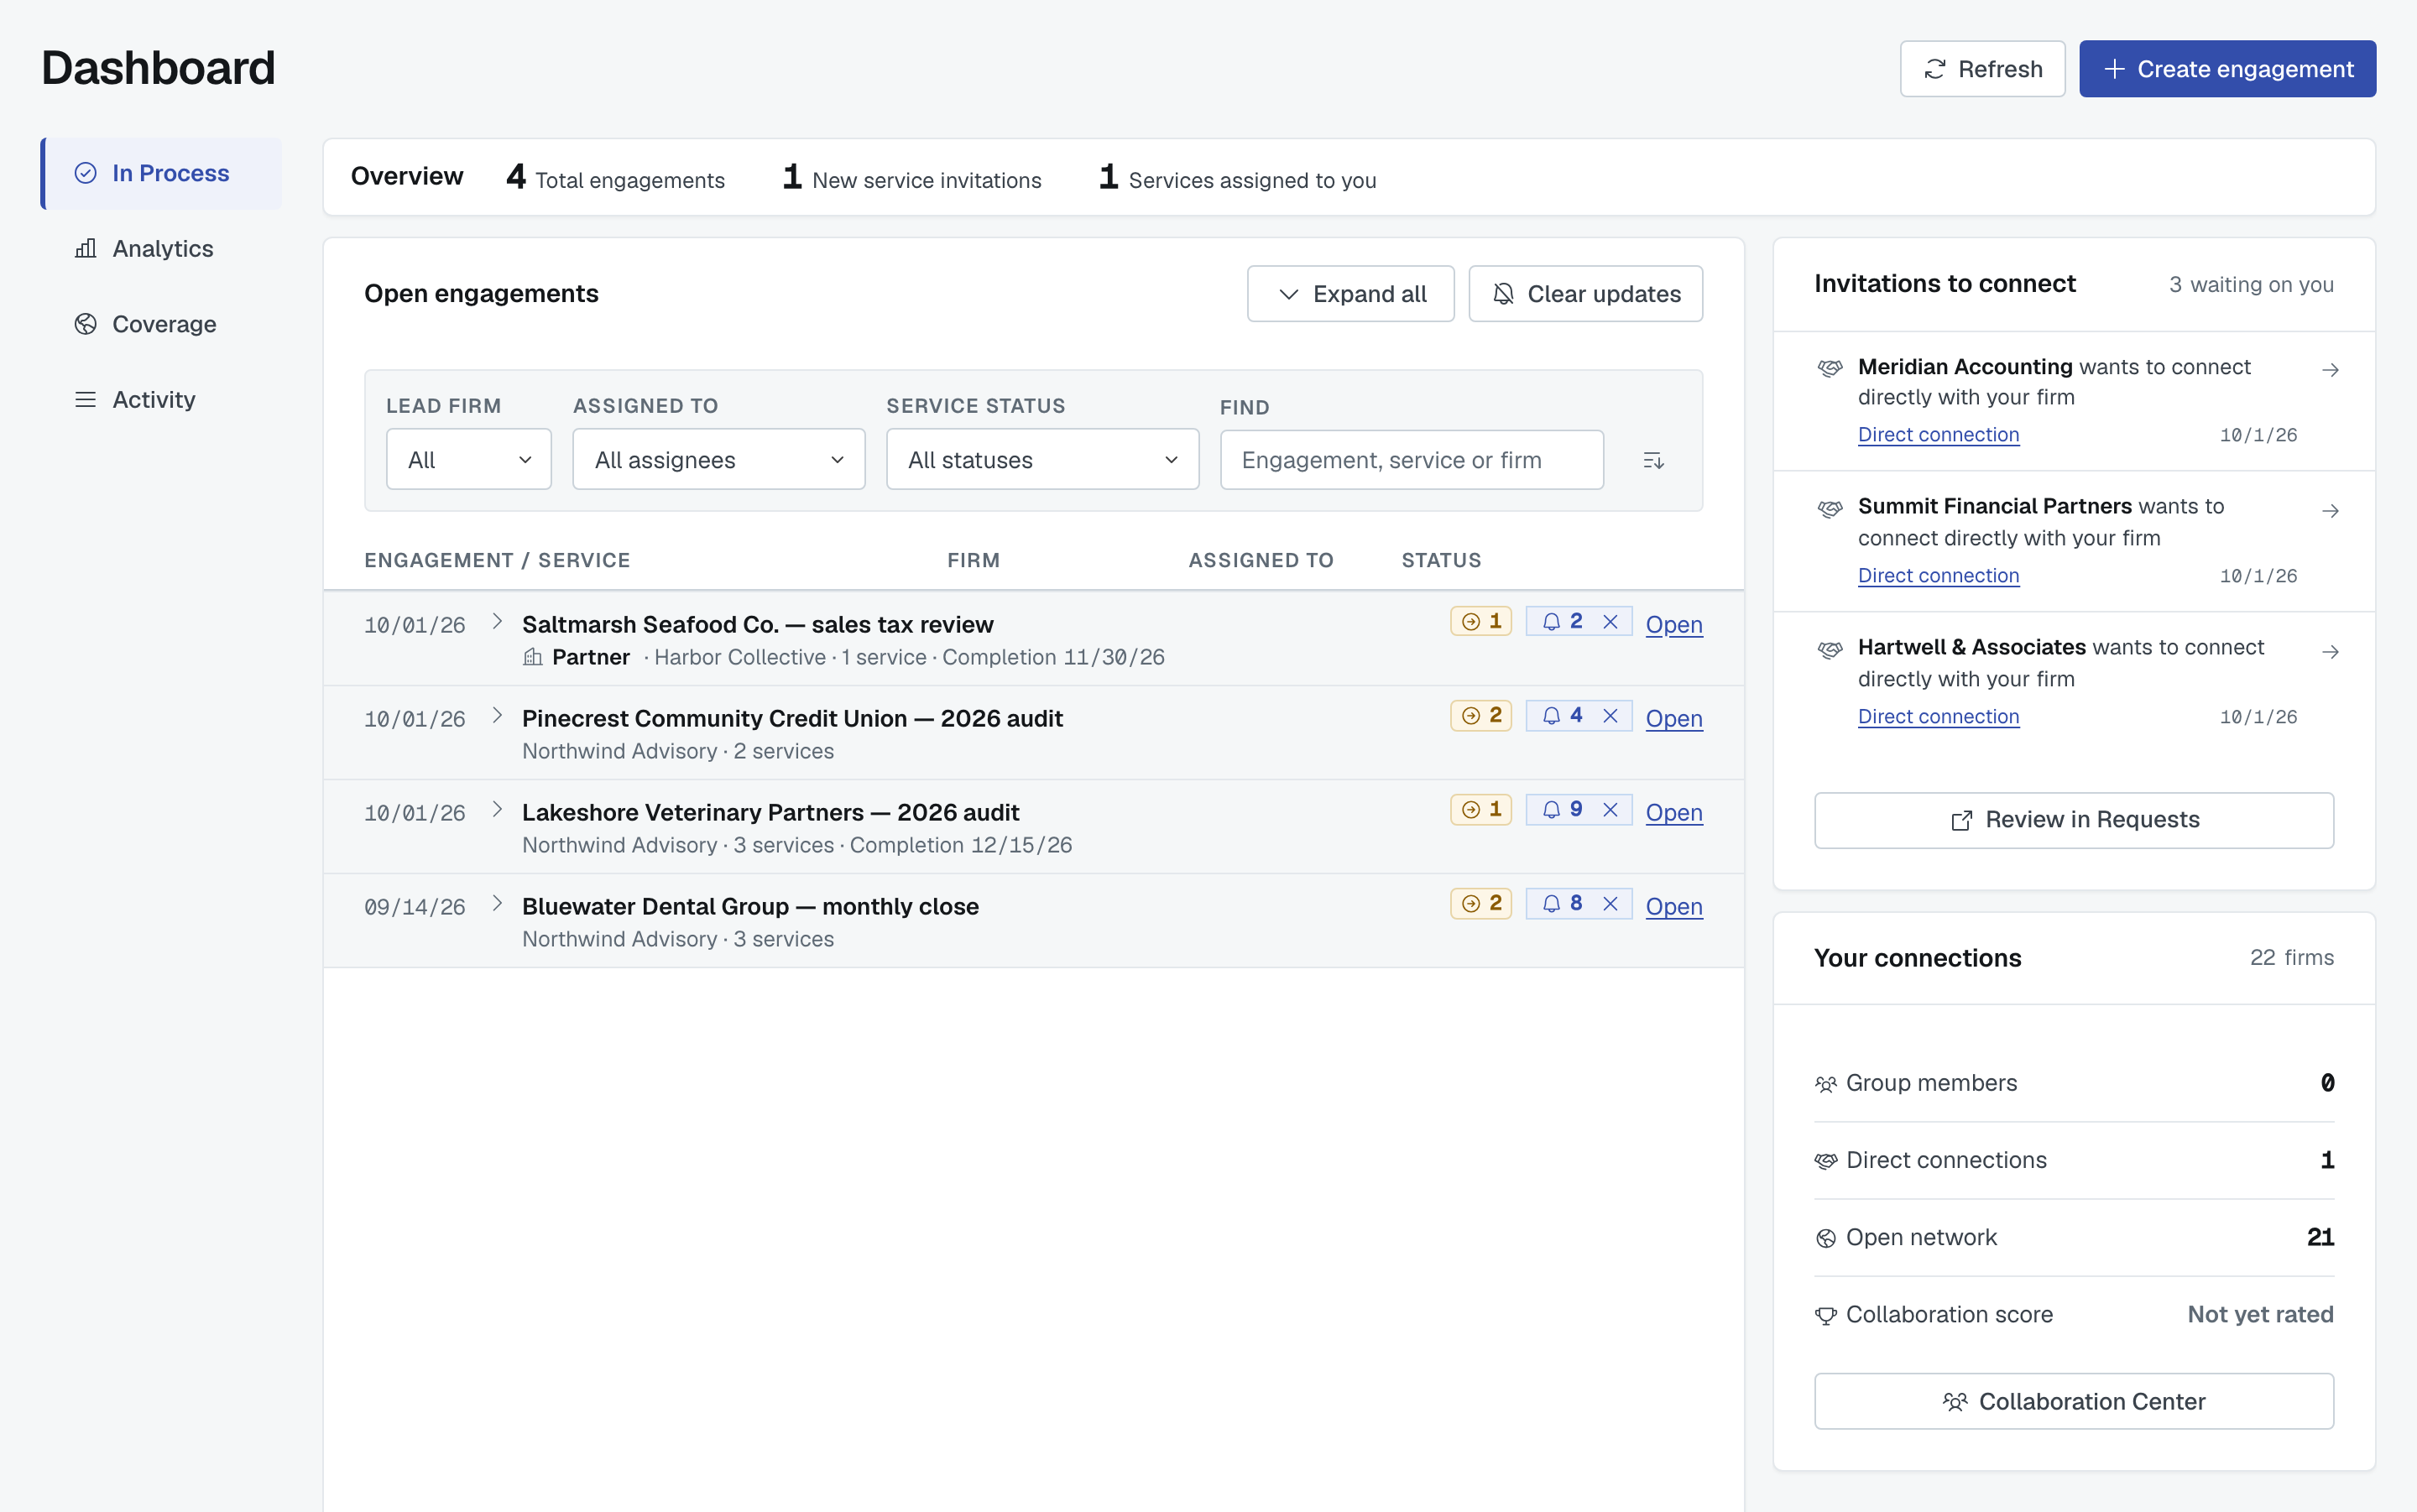
The Dashboard is the first screen you land on, and it answers one question: what needs me today? It's not a report and it's not a list of everything your firm has ever done — it's the work that is still moving, with what each engagement is waiting on next.
Four views sit down the left, in this order: In Process, Analytics, Coverage and Activity. In Process is the one you'll live in.
Two buttons sit at the top right of the page: Refresh, which re-reads the figures, the list and the cards on the right, and Create engagement, which starts a new one.
Overview: the three figures
Overview is a strip of three numbers across the top of In Process:
- Total engagements — every engagement on your Open engagements list: the ones your firm leads that are Open, and the ones you were invited onto that are still Invited, wherever you are one of your firm's contacts.
- New service invitations — services another firm has invited you to and you haven't answered.
- Services assigned to you — the services with your own name in the Assigned to column.
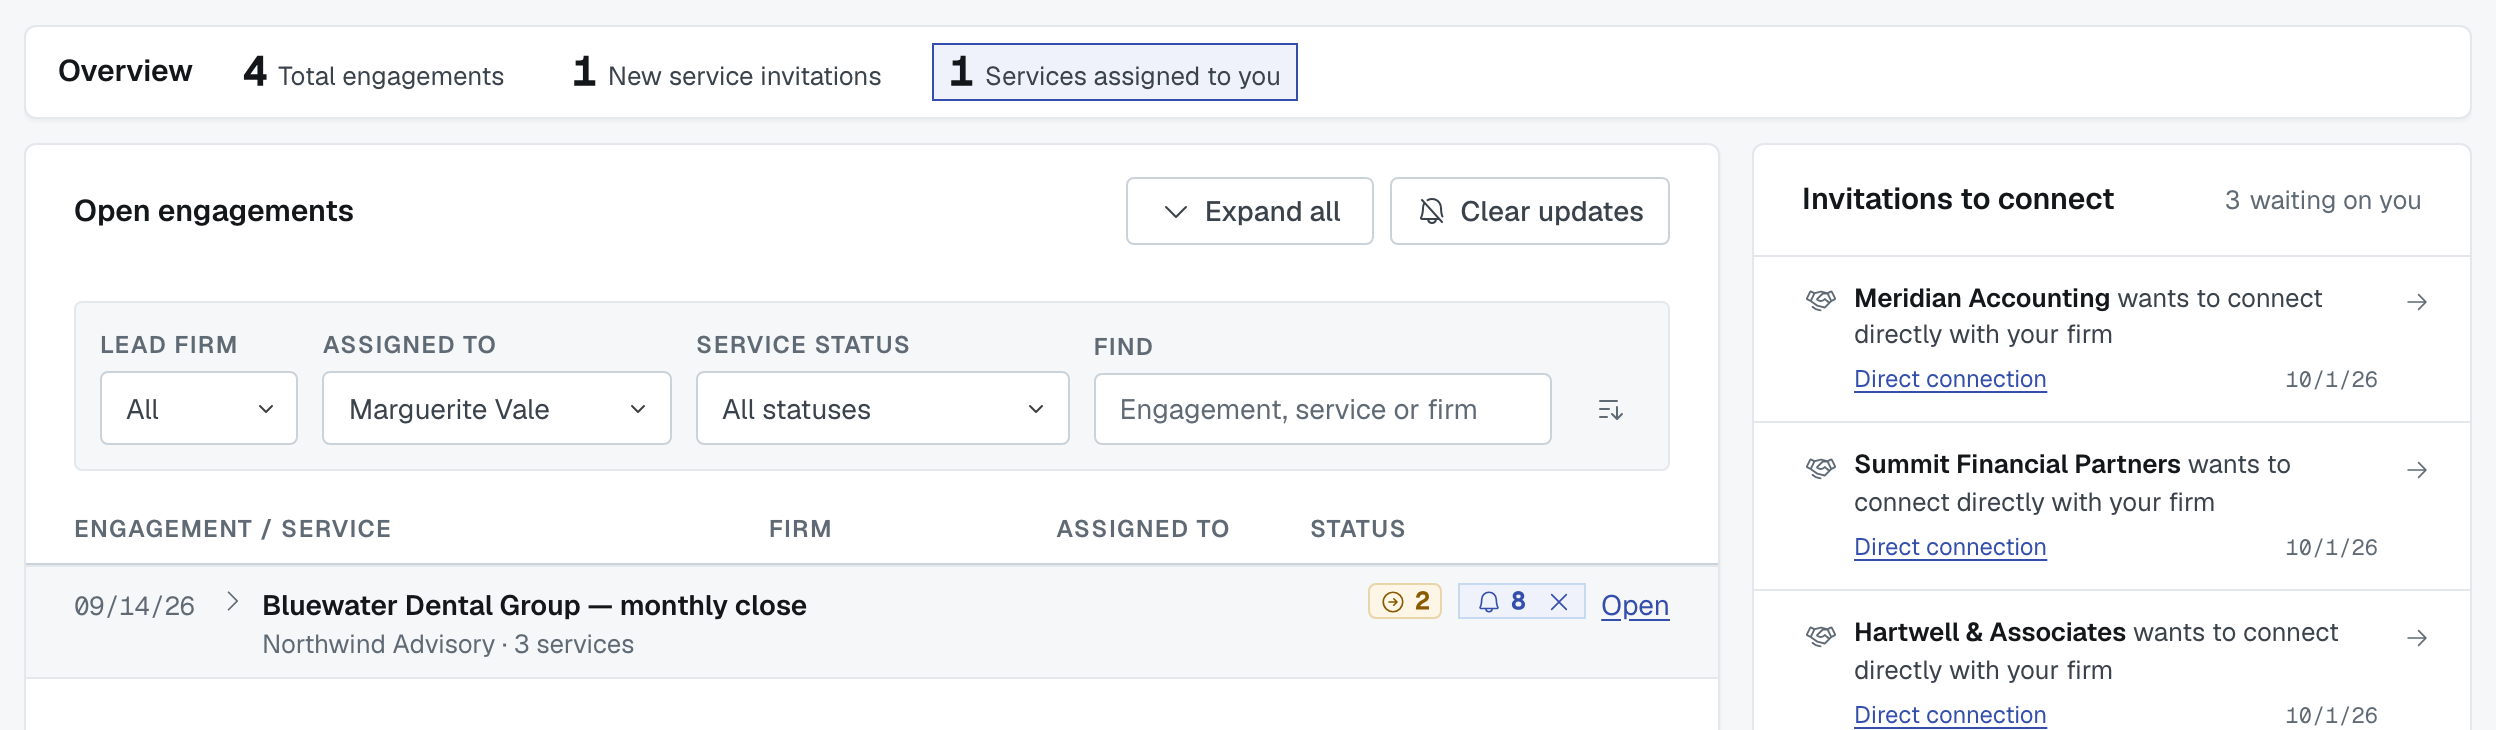
Each figure is a button. Click one and it filters the list below to exactly what it counted. Click the same figure again and the filters clear. A figure showing 0 can't be clicked — there's nothing to filter to.
Open engagements: the list
Open engagements is the card under the Overview strip. One line per engagement, collapsed by default.
It lists only engagements you are a contact on. An engagement your firm leads appears while it is Open and you are one of its contacts; one you were invited onto appears while your firm's status on it is Invited and you are one of your firm's contacts on it. This applies to administrators too — there is no "show everything" switch. To see every engagement your firm is in, use the Engagements list instead (see The Engagements list: scope, filters and what each status means). To get an engagement onto your own dashboard, have a colleague add you as a contact on it.
Line one starts with the date the engagement started for your firm, written like 08/03/26 — the day your firm launched it if you lead it, or the day you were first invited to one of its services if another firm leads it. Hover over the date and it tells you which. Then comes the engagement's name, with Open at the end of the line.
Line two shows the firm leading it (with a Partner tag in front if that is another firm), how many services it holds and, if the lead firm set one, its Completion deadline. Once the deadline has passed, Completion turns red with a warning mark, so an overdue engagement stands out.
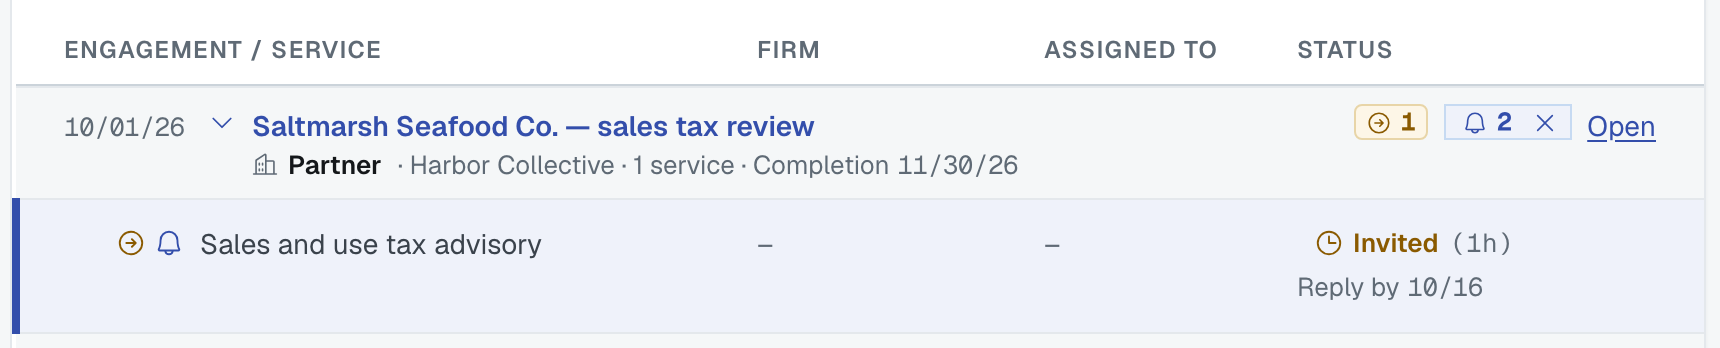
Click the engagement's name to expand it and see its services underneath, with four columns: Engagement / service, Firm, Assigned to and Status. An Assigned to cell with nobody in it reads as a dash. Expand all / Collapse all in the card header does the whole list at once.
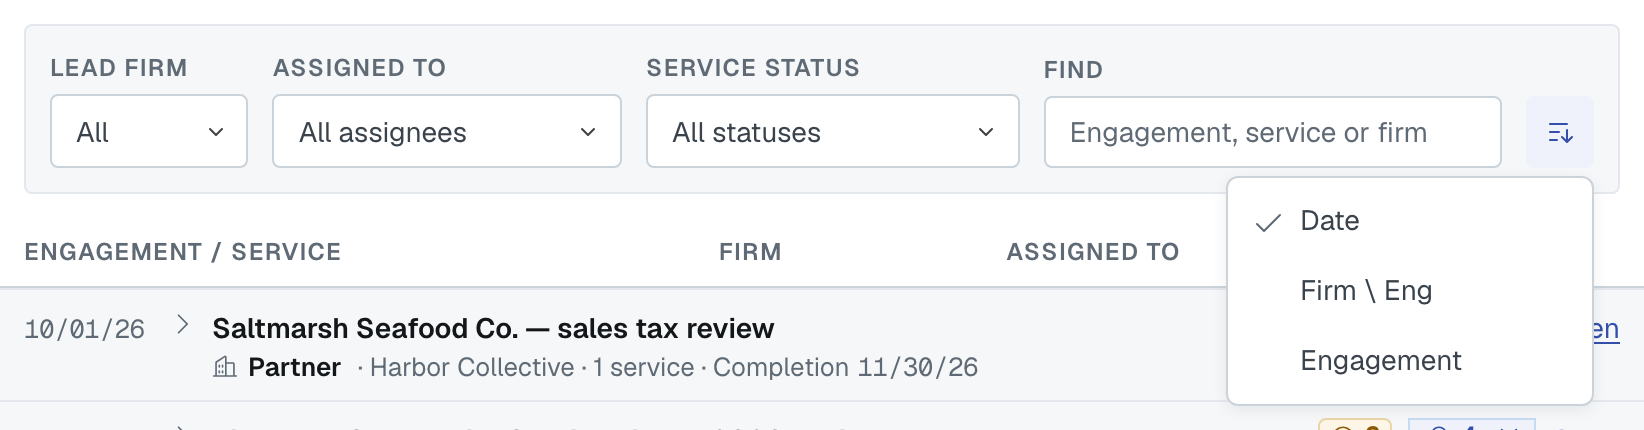
The list opens newest first, by the started date, with engagements you lead and ones you were invited onto mixed together. The Sort button at the end of the toolbar (an icon; hover over it to see the current order) offers Date (newest first), Firm \ Eng (lead firm, then engagement name) and Engagement (by name).
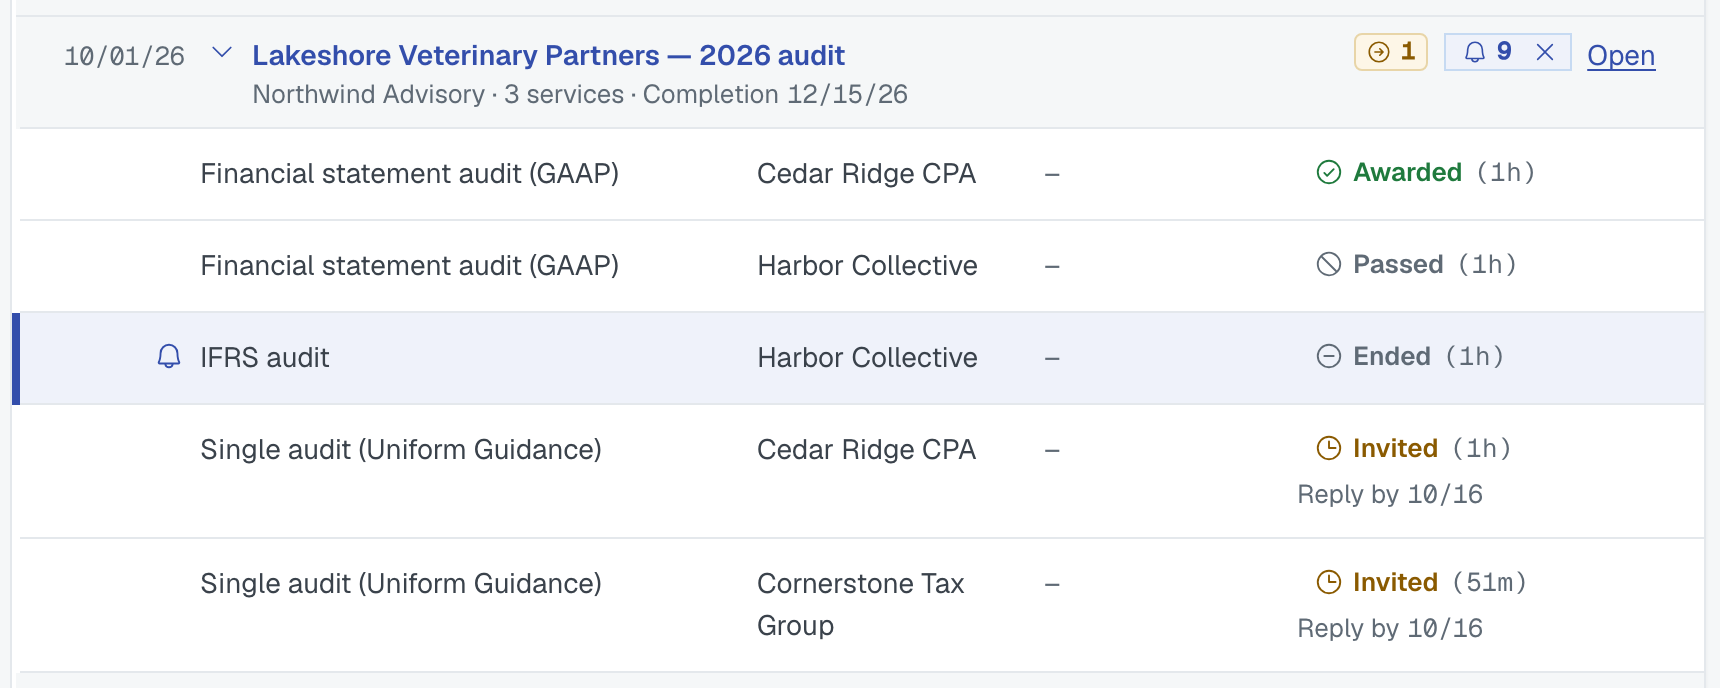
Not every service shows straight away. Awarded, Resource Secured and Ended lines always show — the dashboard calls an award that was terminated or withdrawn Ended. Lines that were Declined, Passed or Canceled are tucked away, unless they carry an update you haven't cleared yet, and Show hidden services and invitations brings them back for that engagement.
Open, on the right of each engagement's line, takes you to the engagement itself — or straight to your invitation, if that's your side of it. That's where you act: see Reading an engagement.
The two chips: needs you and updates
Two small chips can sit on an engagement's line, and they mean different things. Each is an icon and a number, with no words beside it (only a very wide window has room for the words); hover over a chip to see what it counts.
The needs-you chip — a circled arrow and a number — counts the lines on that engagement that are waiting on your firm — a service with nobody invited yet, an employee to assign, a firm to award, an invitation to answer. It's a statement of fact, not a button; it goes away when you deal with the thing.
The updates chip — a bell and a number — counts what has happened on that engagement since you last cleared it. This one is a button, with an ✕ on it, and it's how you clear updates. Inside the expanded engagement, a small bell beside a service marks the line that changed.
Clearing updates
There are three sizes of the same action, and none of them asks you to confirm:
- One service line. Click its Status chip where it's marked as updated. That clears just that line.
- One engagement. Click its updates chip (the bell). That clears everything on that engagement.
- The whole list. Clear updates in the Open engagements card header. When there's nothing to clear it's greyed out and says so.

Clearing is about your view of what's new. It changes nothing on the engagement and tells nobody. See Updates on the dashboard: what marks a change, and how to clear it for what counts as an update.
Finding one engagement or service
Find — the box in the Open engagements toolbar, with the placeholder Engagement, service or firm — narrows the list you're looking at. It's a filter on this screen, not a search of the app.
Beside it are three dropdowns that do the same job in coarser cuts: Lead firm (All / Ours / Partners), Assigned to (All assignees, Unassigned, or a colleague by name), and Service status (All statuses, or one of the open statuses). Filter to nothing and the list says No engagements match these filters.
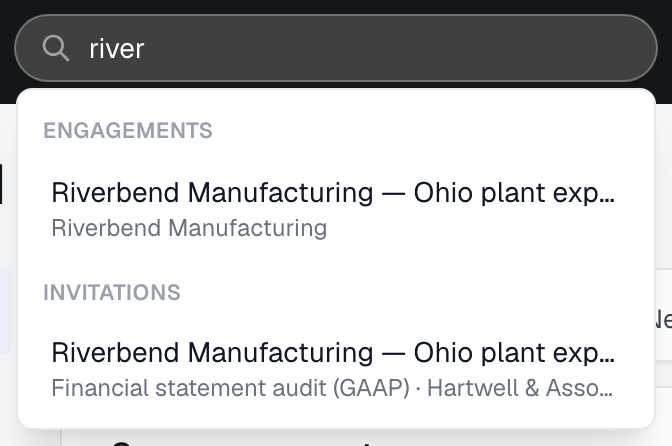
To search the whole app, use the Search... box in the bar at the top of every screen. It looks across Engagements, Invitations, Firms, Employees and Services as you type, and takes you to whatever you pick.
Your network, on the rail
The right-hand rail is about your network. There is no notifications list on it any more.
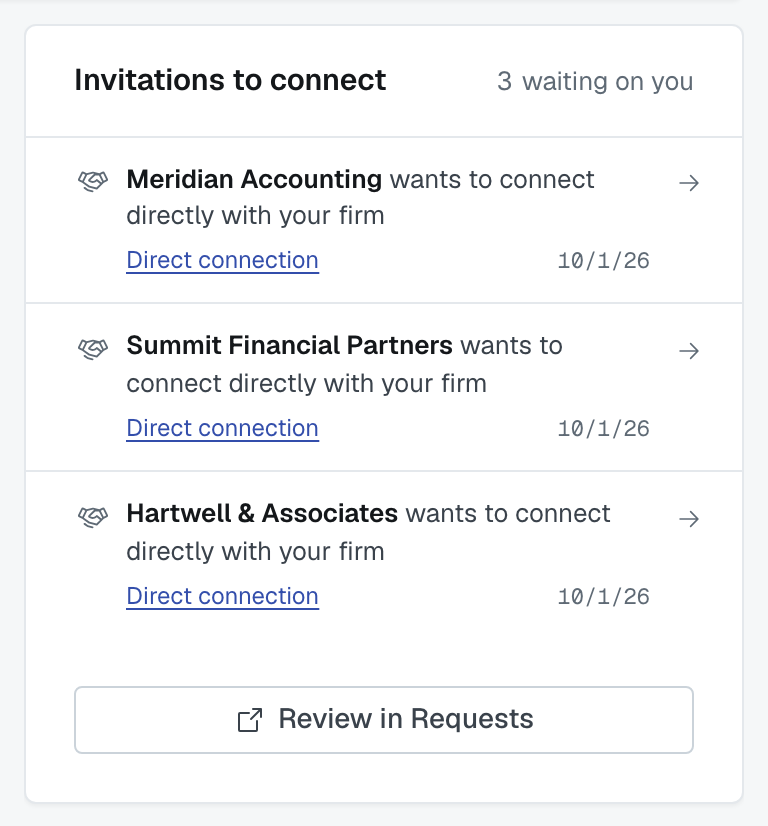
Invitations to connect appears only when requests are waiting on your firm, with the number waiting in its header. Each row shows the request — who sent it and, for a group, which group — with a link naming what kind of request it is, and the date. Every row, and the Review in Requests button under the list, opens Collaboration › Requests.
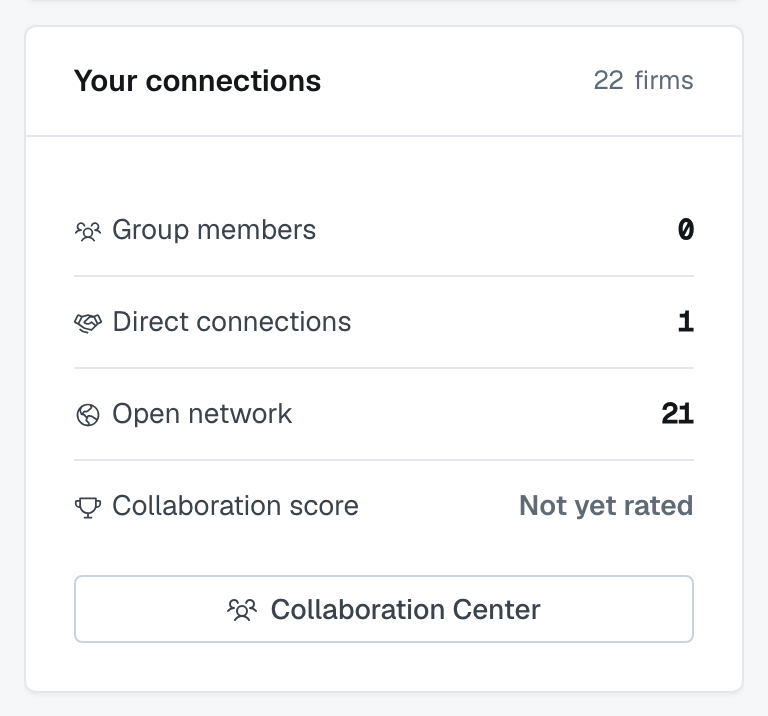
Your connections is always there: a firm count in the header, then Group members, Direct connections, Open network and Collaboration score. Open network reads Off if your firm has switched it off, or Upgrade if your plan doesn't include it. The header count includes the firms you can reach through open networking when your firm has it switched on; when it is off, those firms are not counted, because you can't be matched with them.
See Connections, groups and open networking: which to use for what those numbers mean, and Your Collaboration Score for the last row.
You can't manage your network from here
The Dashboard shows your network; it doesn't manage it. There's nothing on this screen to accept a connection request, invite a firm, create a group or answer an application — and the Invitations to connect card deliberately has no Accept or Decline on it.
Go to the Collaboration Center instead. The Collaboration Center button, at the bottom of the Your connections card, takes you there, and the rows and Review in Requests on the Invitations to connect card take you to the requests waiting on you. Everything network lives there: see Respond to connection and group requests.
Analytics
Analytics is the numbers over a period you choose. The Time period list offers Last 30 days, Last 90 days, Last 6 months, Last 12 months (the default), Year to date and All time — the same list as on Coverage. A User list narrows the figures to one colleague.
- New engagements — by month.
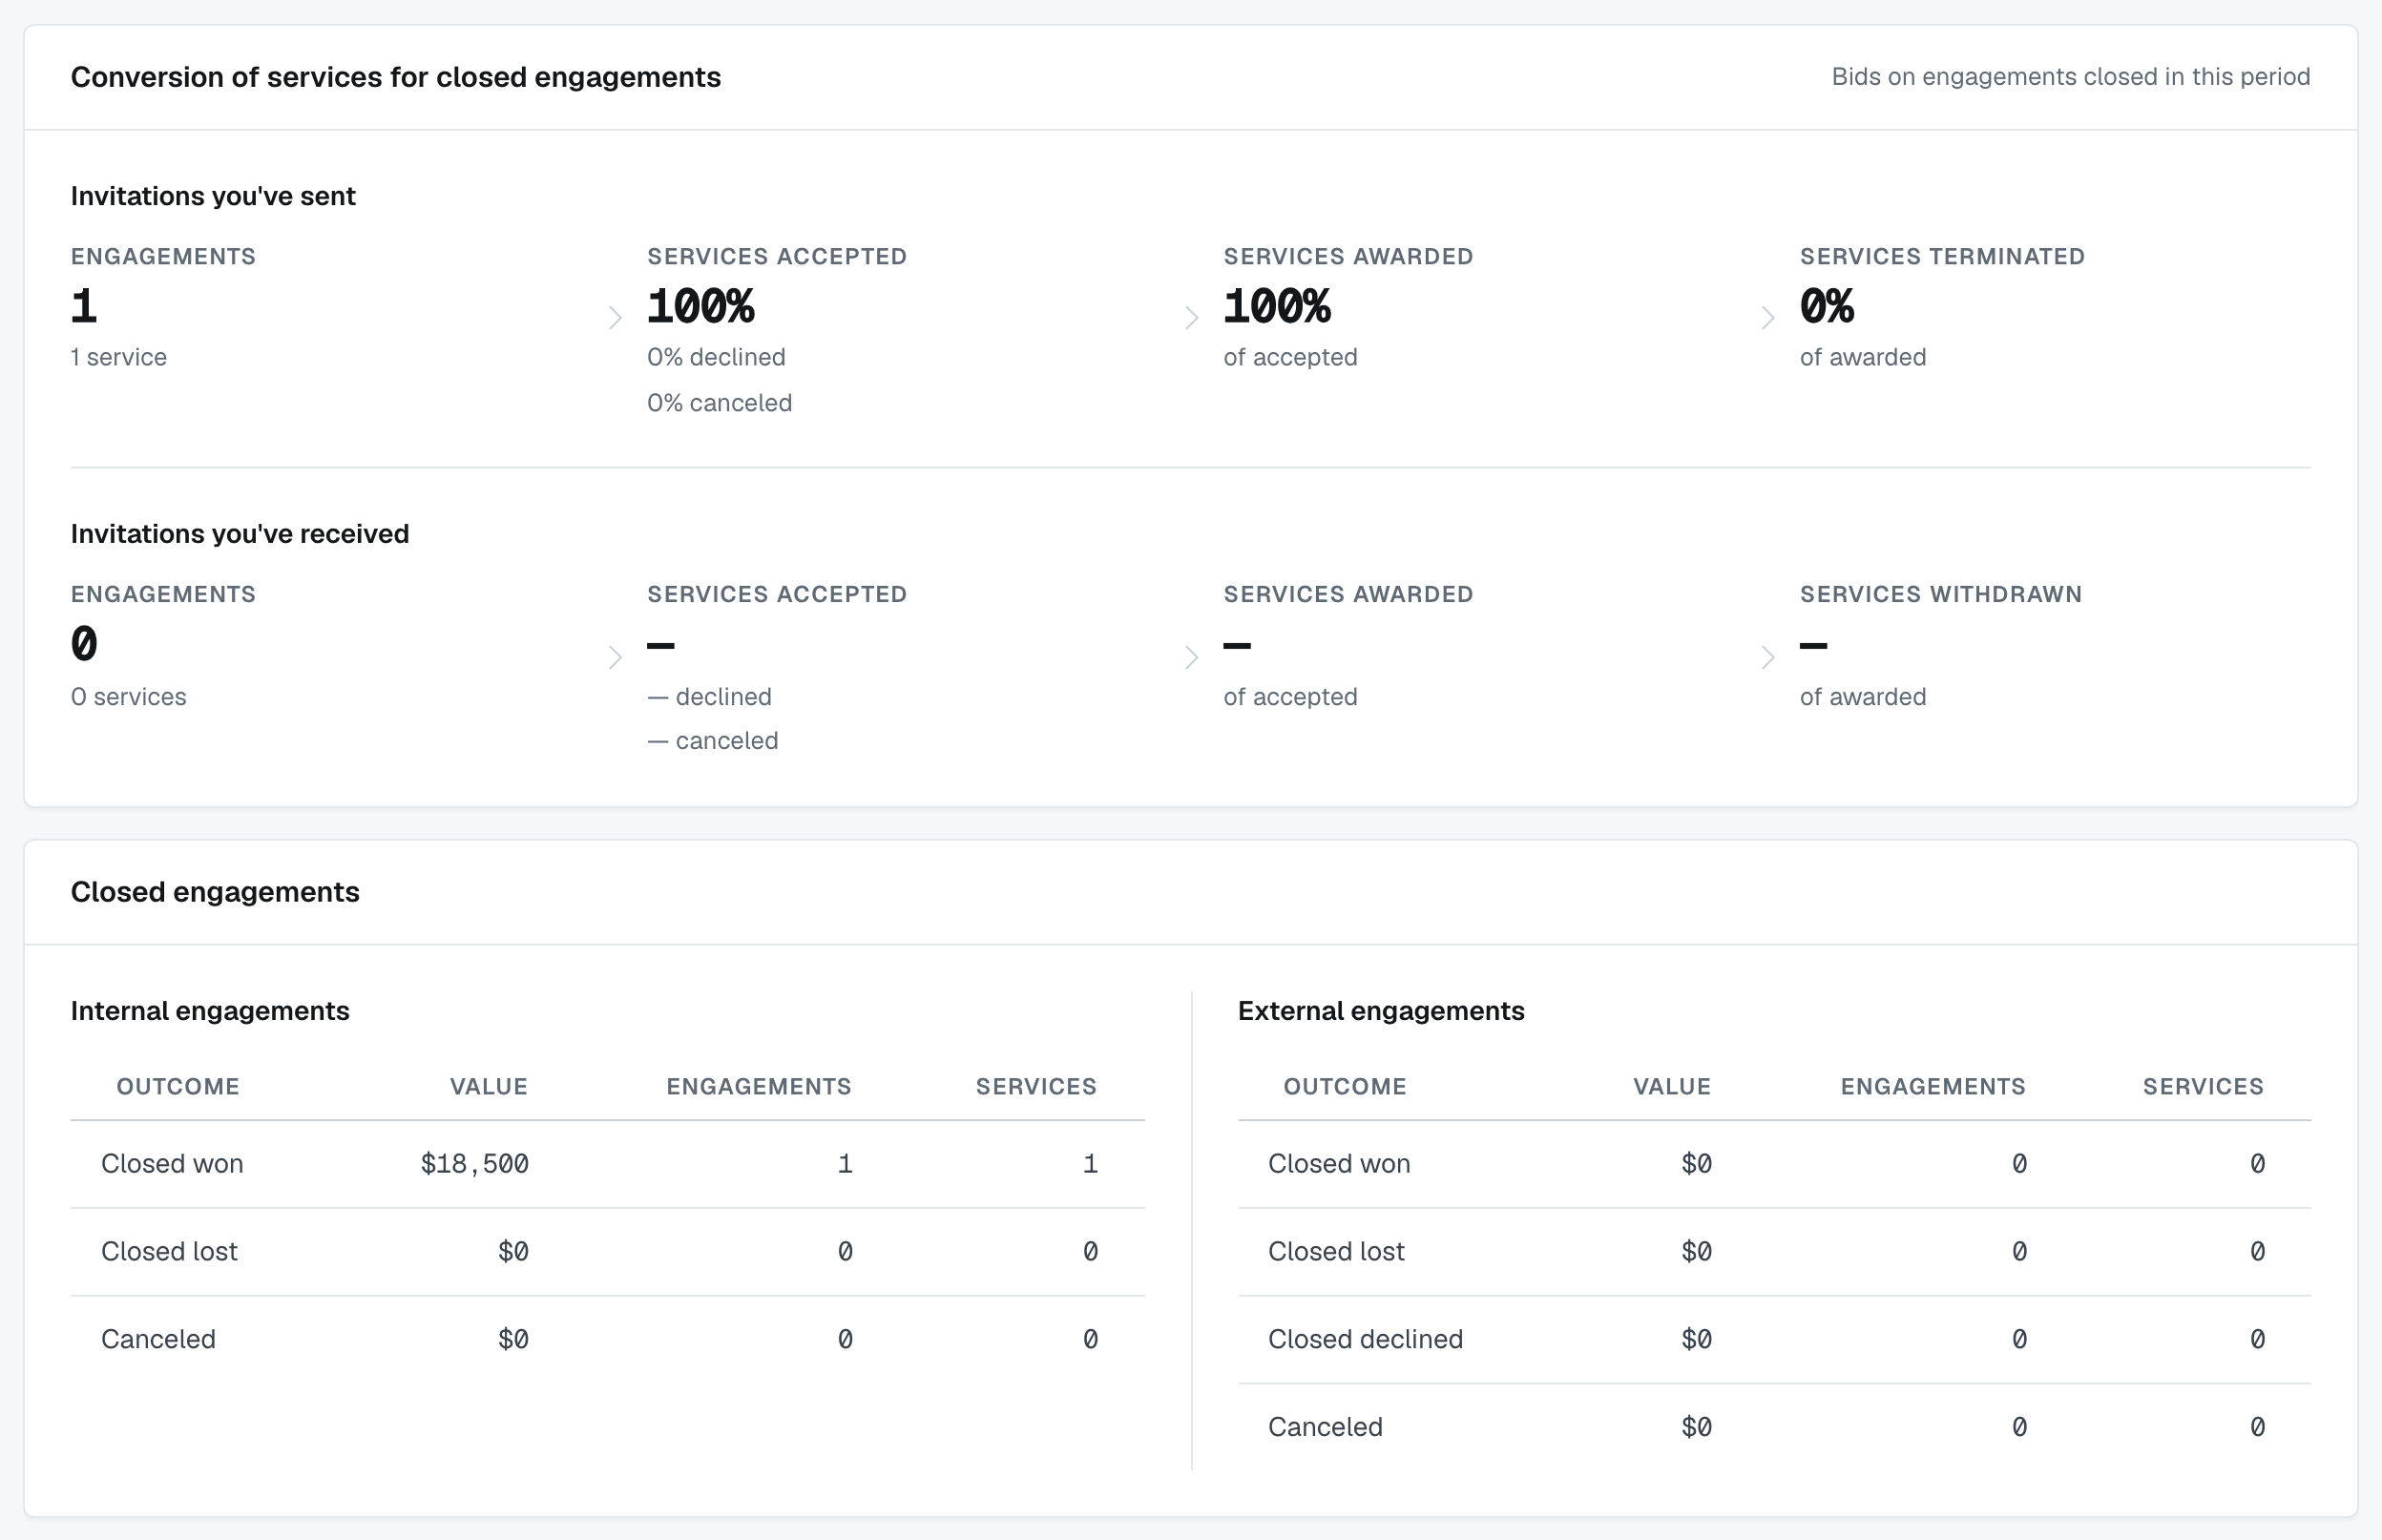
- Conversion of services for closed engagements — two funnels, one above the other, each on one row. Invitations you've sent runs Engagements → Services accepted → Services awarded (as a share of accepted) → Services terminated. Invitations you've received runs the same way but ends with Services withdrawn. Both last steps are a share of awarded: Services terminated is how many of the awards you made you later terminated, and Services withdrawn is how many of the awards your firm won it later withdrew from.
- Closed engagements — two tables, Internal engagements (ones your firm leads) and External engagements (ones you were invited onto), each with Closed won, Closed lost and Canceled rows showing value, engagements and services. External also has a Closed declined row, for engagements your firm closed after declining the services you were invited to; its value is always $0. A firm whose award ended is still counted here, under the status it chose.
- Four ranked tables — Top services you outsource, Top services you provide, Top partners you outsource to and Top partners who outsource to you.
Coverage
Coverage answers "what can my network actually do?" — five tiles (Connected Firms, Your Services, Network Services, Your Industries, Network Industries) over Services, Industries and Locations sub-tabs, filterable by Group, by Firm and by Time period (the same list as Analytics).
Activity
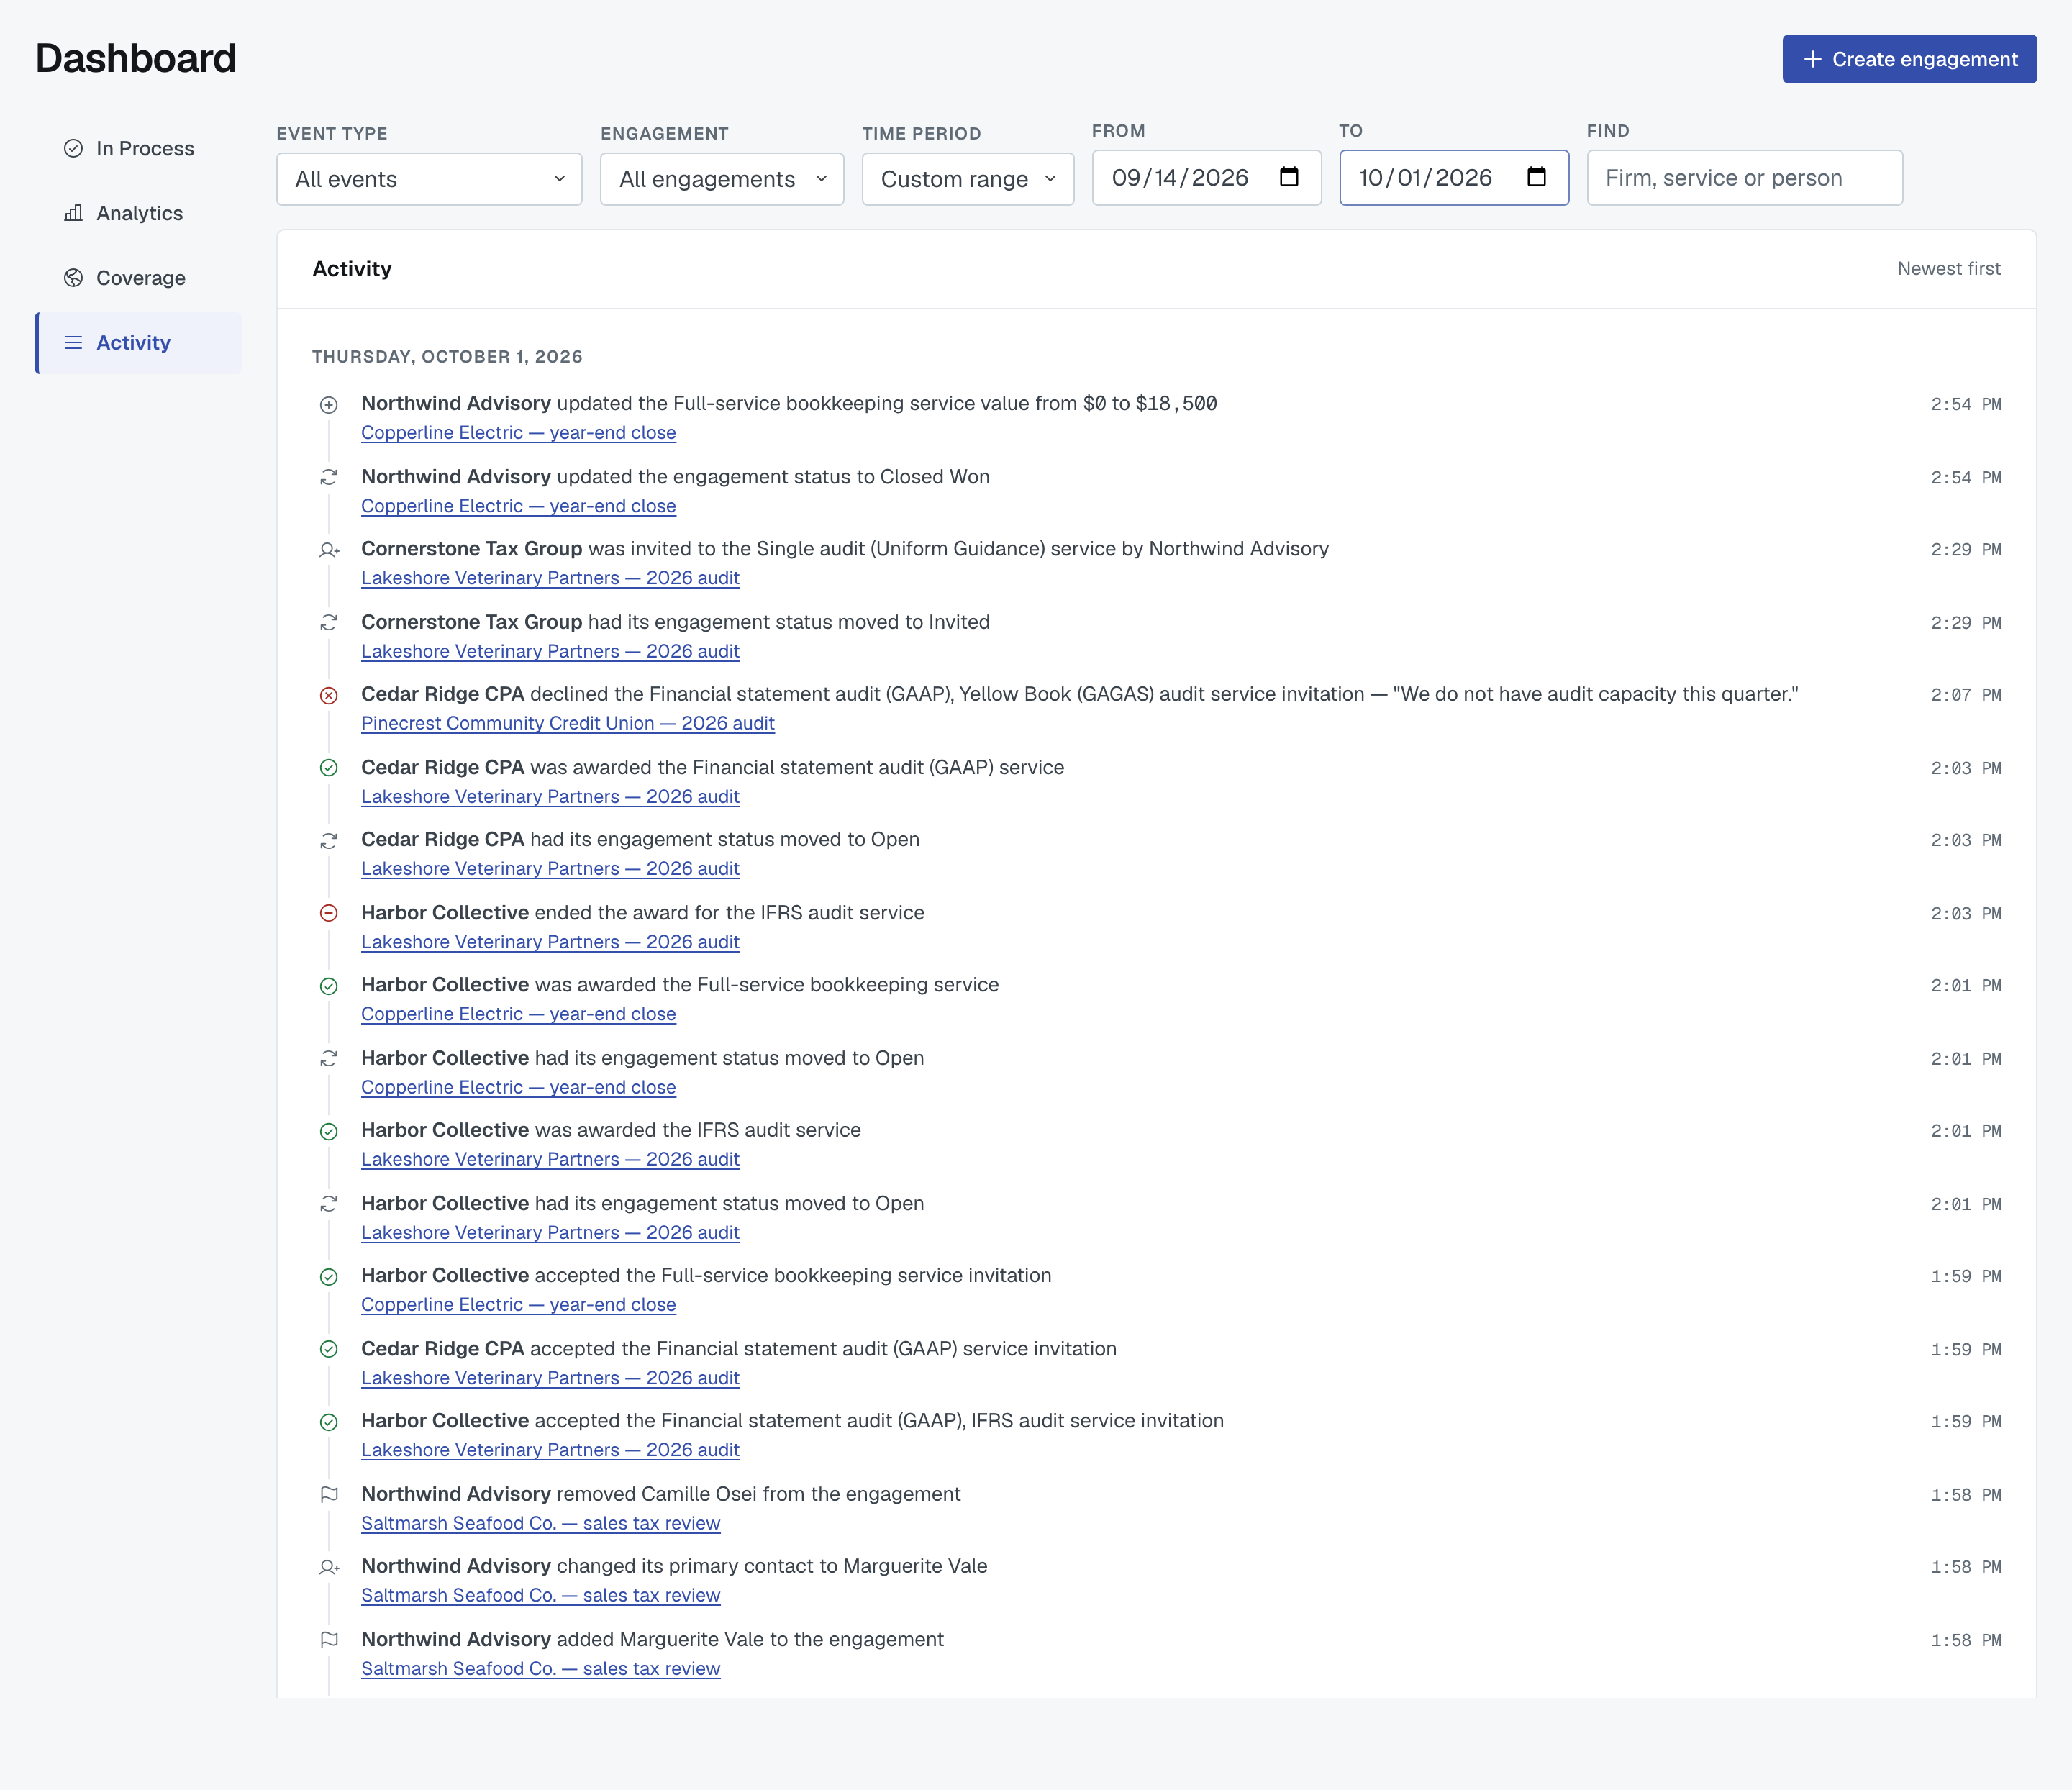
Activity is the full log of what has happened on your firm's engagements, newest first, grouped by day. It filters by Event type, by Engagement, by Time period, and by a Find box that takes a firm, a service or a person.
Time period offers Today, Yesterday, Last 7 days, Last 30 days and Custom range, and it opens on Last 7 days. Choosing Custom range shows two date boxes, From and To: To can't be earlier than From, and neither can be later than today. Every period is whole calendar days in your own time zone — Last 7 days is today plus the six days before it. There is no "all time" choice; use Custom range to reach further back. A period with nothing in it says so.
Who sees what
Nothing on the Dashboard is hidden by role. Members, editors and admins all see the same four views. What differs is what your firm is involved in, which engagements you are a contact on, and what your own name is against. Roles matter elsewhere — see Roles explained: Regular, Editor, and Admin.
Was this article helpful?
That’s Great!
Thank you for your feedback
Sorry! We couldn't be helpful
Thank you for your feedback
Feedback sent
We appreciate your effort and will try to fix the article